








Medallion fund returns are often described as the most unusual performance record in modern finance. Yet the public story is fragmented, because the fund is private and details are limited.
This article focuses on what can be checked, how to read reported numbers correctly, and why comparisons with the S&P 500 are easy to misunderstand.
What is “Medallion Fund Returns”?
Medallion fund returns describe the Medallion Fund’s performance over a defined period, often expressed as a compound annual growth rate (CAGR). Figures may be reported before fees (gross) or after fees (net), which can materially change the result.
When you read a return figure, confirm the time window, whether it is annualised, and whether the number is gross or net.
What is the Medallion Fund?
The Medallion Fund is a private hedge fund run by Renaissance Technologies, founded by Jim Simons. It is best known for its exceptional long-term medallion fund returns, achieved through systematic, quantitative trading rather than human stock picking.
Medallion is not open to the public. It has been closed to outside investors for decades and mainly serves Renaissance employees and related parties, which is one reason its performance is hard to verify from public data.
What does the Medallion Fund performance record show?
Most medallion fund returns are reported figures rather than a full public return series released directly by the fund. Sources often rely on interviews, books, investor commentary, or secondary reporting, so the same period can be summarised differently.
This is why medallion fund returns may vary across articles, especially when authors mix time windows or use different assumptions.
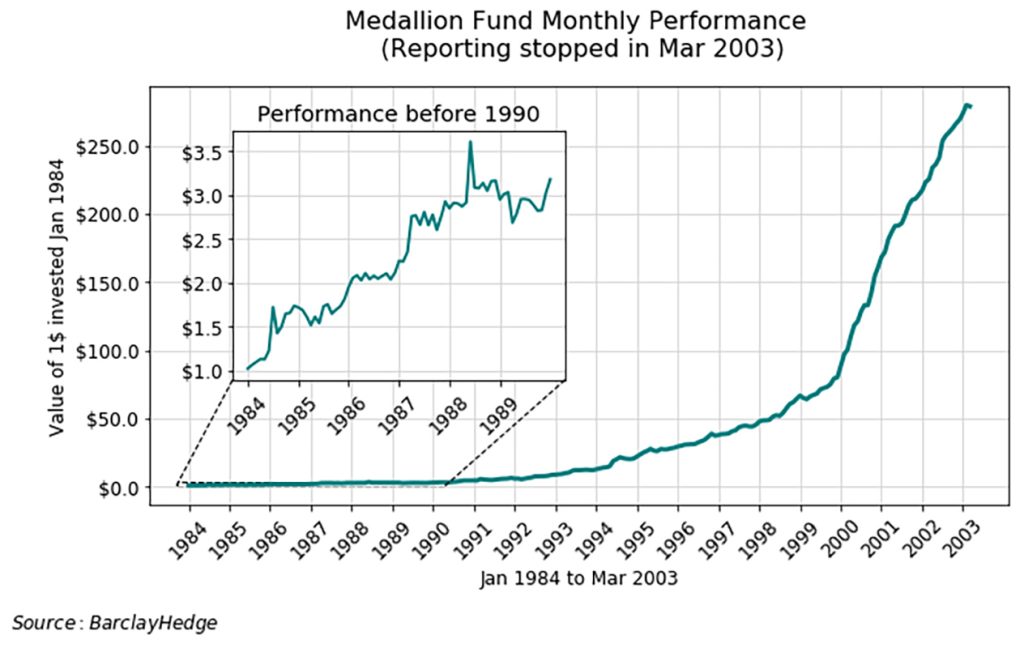
Reported Medallion Fund returns: common figures you will see
According to Institutional Investor, two figures are widely cited in public commentary:
- About 66% average annual return before fees (gross), 1988-2018.
- About 39% average annual return after fees (net), 1988-2018.
You may also see other windows, such as 1994 to mid-2014, with higher pre-fee averages reported.
Q: Why do some sources show Medallion returns “after fees”, but still look unusually high?
A: Medallion is often described as having an unusual fee setup and internal investor base. This can affect how profits are distributed and how net figures are reported. It also means headline “net” results may not be comparable with standard hedge funds that serve outside clients.
Gross vs net returns and why fees change the headline
Gross returns are performance results before fees, while net returns are the amount remaining after management and performance fees are deducted. With a high-fee structure, the gap between gross and net can be large, so the medallion fund average return depends on which figure is quoted.
When you see a number, confirm whether it is annualised, and whether it is reported as gross, net, or “after fees and costs”.
Time windows are commonly referenced, and why dates matter
The Medallion Fund has operated for decades, but public discussion often focuses on periods when compounding looks most dramatic. Changing the start year, end year, or whether interim losses are included can materially change any stated CAGR for medallion fund returns.
A fair reading always states the exact window and avoids comparing numbers across different market regimes and disclosure quality.
Key performance terms you must understand
- CAGR: is the compound annual growth rate, meaning the steady yearly rate that would produce the same total growth over a period.
- Drawdown: is the peak-to-trough decline, showing how deep losses became before the fund recovered to a new high.
- Sharpe ratio: measures return per unit of volatility, helping you judge whether strong returns were achieved with controlled risk or wild swings.
Medallion Fund vs S&P 500
The Medallion Fund vs S&P 500 comparison asks one simple question: Did Medallion compound faster than a passive US equity index?
- S&P 500: A long-only equity benchmark. Use total return (price + dividends) for any serious comparison.
- Medallion Fund: A private hedge fund that used systematic trading, likely across many instruments, with high turnover and possible leverage.
Comparison table
| Item | Medallion Fund (reported) | S&P 500 (total return) | Method notes |
|---|---|---|---|
| Data availability | Limited public reporting | Public index history | Medallion figures can vary by source and definition. |
| Return format | Often shown as CAGR | Can be shown as CAGR | Use CAGR for both to keep the comparison consistent. |
| Fees | Gross or net, must be stated | Low fund fees if using an ETF | Net figures are closer to what investors actually received. |
| Dividends | Not applicable in the same way | Must be included | Always use total return, not price-only returns. |
| Risk profile | May include leverage, shorting | Long-only equities | Risk budgets differ, so “better” is not only about return. |
| Trading costs | High turnover, cost-sensitive | Low turnover | Ignoring costs favours high-frequency strategies unfairly. |
Q: What is the main reason Medallion Fund vs S&P 500 comparisons can be unfair, even with the same dates?
A: The S&P 500 is a long-only equity benchmark, but Medallion is closer to a multi-strategy trading book. It can hold both long and short positions, may use leverage, and often has very low exposure to market direction. This means the benchmark may not match the fund’s risk type, even if the maths is correct.
What does the Medallion Fund trade? Asset coverage
The Medallion Fund is not limited to equities, and public sources describe it as a multi-asset trading operation.
In plain terms, multi-asset means the models can trade multiple markets rather than just one to find more frequent statistical opportunities.
Reported asset categories
Public reporting and book-based summaries often describe Medallion trading in equities, as well as bond, commodity, and currency markets. These trades are usually short-term and systematic, which supports the idea that medallion fund returns came from many small edges across instruments.
Why multi-asset coverage matters
Multi-asset trading expands the opportunity set because the same modelling approach can be applied across equities, futures, forex, and other markets. It also supports cleaner portfolio construction because returns can come from multiple drivers, not just one equity risk cycle.
For a statistical arbitrage strategy, this breadth can improve signal selection and reduce reliance on any single dataset or market microstructure.
Why did Medallion Fund returns stay exclusive?
Medallion stayed exclusive because its edge depended on capacity, execution quality, and secrecy, not just clever models.
- Capacity limits: Many statistical arbitrage opportunities are small, so more capital can dilute returns and raise market impact.
- Execution advantage: High-turnover strategies need tight spreads and low slippage, which are harder to achieve at larger sizes or during outside flows.
- Secrecy and durability: If signals leak, competitors copy them, and the edge decays faster.
- Operational control: Limiting investors reduces redemption pressure and lets the fund manage risk and leverage more consistently.
Jim Simons’ trading strategy secret
Jim Simons’ trading strategy is best described as systematic, using data and rules rather than opinions. The goal is to find small edges that repeat, then trade them many times with strict risk limits. Public sources do not show the full models, so it is safer to explain the framework rather than claim specific “secret signals”.

Statistical arbitrage as the core family
Statistical arbitrage trades on temporary mispricing between related assets, such as pairs, baskets, or instruments linked by common risk drivers. The model measures how far the relationship has moved from its normal range, then trades the expected realignment with defined exits.
It uses rules for entry, position sizing, and closure, and it tracks correlation breakdown risk as part of normal trade management.
Mean reversion and regime filters
Mean reversion is one common idea in statistical arbitrage. It assumes that prices often return to a normal range after extreme moves. It can fail in strong trends or during volatility jumps, when relationships change. Regime filters try to reduce or pause trading when market conditions shift.
Execution and HFT as an edge multiplier
High-Frequency Trading (HFT) covers a range of approaches, from fast execution tactics to ultra-low-latency trading across multiple venues. When the expected profit per trade is small, latency and execution quality often decide whether the edge survives live conditions.
Fill rates, queue position, and order routing affect realised prices, so poor execution can turn a positive model into a losing one.
Q: Why can two identical algorithms earn different results in live trading?
A: Live performance depends on execution infrastructure, not only signals. Differences in broker routing, queue position, fill quality, and partial fills can change realised prices. Over thousands of trades, small execution gaps can compound into large performance differences.
Why other Renaissance funds did not match Medallion Fund returns
Renaissance Technologies runs more than one fund, but the returns of its Medallion Fund differ from those of its public-facing products. Medallion is widely reported as an employee fund and has been closed to outside investors for years.
Medallion is structurally different
Medallion mainly trades with internal capital, which can reduce redemption pressure and improve operational control. Its reported fee levels and the way it is managed are also described as unusual compared with typical institutional funds.
External funds face scale and client constraints
Renaissance’s external funds, such as RIEF and RIDA, are built for outside investors, so they must offer clearer liquidity terms and reporting standards. This product design can restrict leverage, limit the use of less liquid instruments, and require more conservative risk and exposure policies.
As a result, their return profile may differ from Medallion Fund returns, even if some research and technology are shared.
“Renaissance technologies performance” is not one number
When people quote Renaissance technologies’ performance, they often mean Medallion. In reality, different funds can have very different outcomes in the same year, especially during stress events. That is why you should not treat “Renaissance” as a direct proxy for Medallion.
Risk engine and research discipline for Medallion Fund returns
A risk engine and research discipline show why Medallion Fund returns are more than a “good model”. Strong Renaissance technologies performance comes from sizing, testing, and loss control. This framework helps algorithmic trading returns survive real costs and regime shifts.
Kelly Criterion in realistic form for algorithmic trading returns
The Kelly Criterion links position sizing to edge and odds. In practice, traders often use fractional Kelly to reduce drawdown risk. Full Kelly can be fragile, as small estimation errors can lead to large losses.
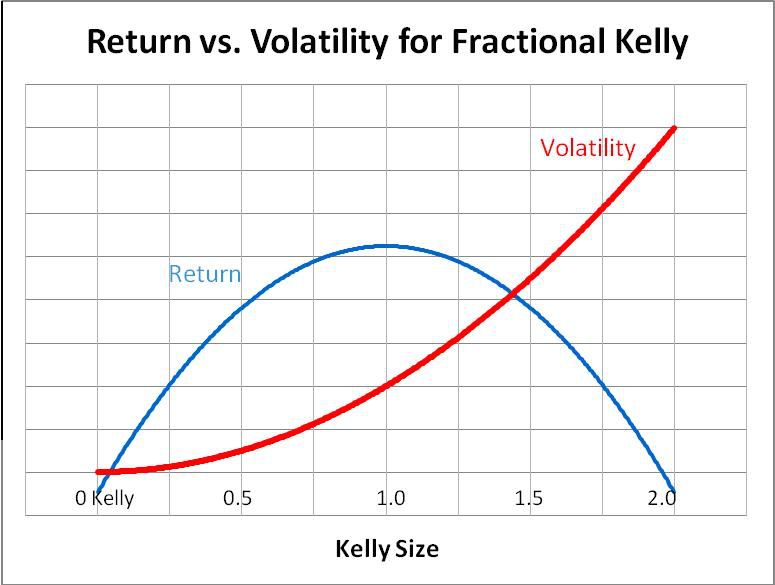
This matters when discussing medallion fund returns, because compounding depends on controlled sizing, not only signal quality.
Backtesting that survives contact with reality for systematic trading
Reliable backtesting must include leakage checks, so the model never uses future data, even indirectly through labels or filters. It must also include transaction cost modelling, because spreads, slippage, and fees can erase small edges in systematic strategies.
Walk-forward testing helps, but it cannot replace clean data boundaries and realistic costs when judging medallion fund historical returns claims.
Hidden Markov Models and robustness in Jim Simons’ trading strategy
Hidden Markov Models (HMMs) can label market regimes, such as calm versus high-volatility periods. This supports more stable execution and can reduce drawdowns during regime shifts.
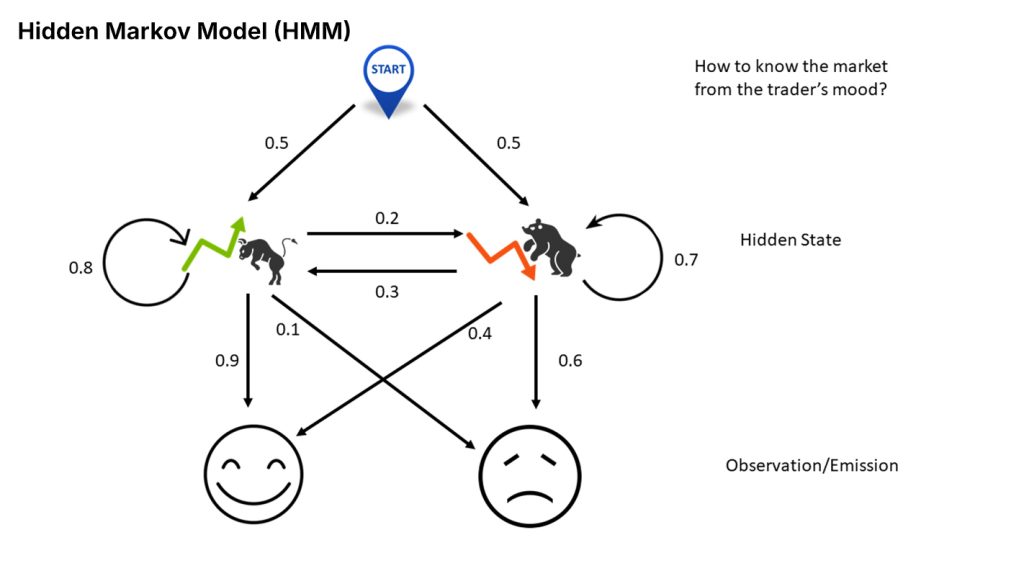
Robustness controls, such as simpler features and stricter validation, reduce the risk of overfitting. This is one defensible way to discuss tools linked to Jim Simons’ trading strategy, without guessing proprietary details.
Conclusion
Medallion fund returns are impressive, but the real lesson is not a single indicator or a copyable formula. The strongest explanation is a complete operating system: multi-asset opportunity search, strict performance measurement, and controls that protect capital when markets shift.
If you want to take something practical from this story, focus on clean backtests, realistic costs, and risk rules that prevent one regime from breaking your approach. Treat modern return claims carefully, and always verify definitions before trusting headlines.