











When three consecutive bearish candlesticks appear on the chart, each closing lower than the previous one, many traders interpret it as a sign of a potential trend reversal. In price action analysis, this formation is known as the Three Black Crows pattern and is commonly used to identify the beginning of selling pressure. Combining this pattern with tools such as the RSI indicator or the MACD indicator can provide a clearer view of market conditions. If you would like to know exactly what this pattern indicates and how it can be applied in Forex trading, stay with us until the end.
What Is the Three Black Crows Pattern and How Does It Work?
On price charts, traders sometimes observe three consecutive bearish candlesticks, each closing lower than the previous one. This formation indicates that buying pressure is weakening. This structure is known as the Three Black Crows pattern, and many traders consider it one of the most important bearish reversal signals.
The pattern can appear across different timeframes, such as daily or hourly charts, and it plays a significant role in Forex trading by helping traders identify the start of selling pressure. As highlighted by Investopedia, this pattern is often interpreted as a strong warning that an uptrend may be ending and a downtrend could be beginning.
How to Identify the Three Black Crows Pattern on a Chart
To recognize a Three Black Crows pattern on a chart, pay attention to the following characteristics:
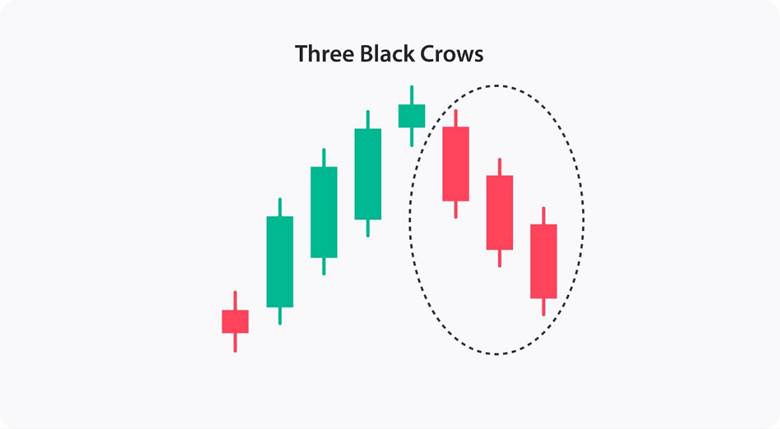
- Three consecutive bearish candlesticks with long bodies and little to no shadows
- Each candlestick opens within the body of the previous one and closes lower
- This formation typically appears at the end of an uptrend and signals a potential reversal
- Trading volume usually increases during the formation of these three candles, confirming the strength of sellers (higher volume adds more credibility to the pattern)
The Psychology Behind the Three Black Crows Pattern
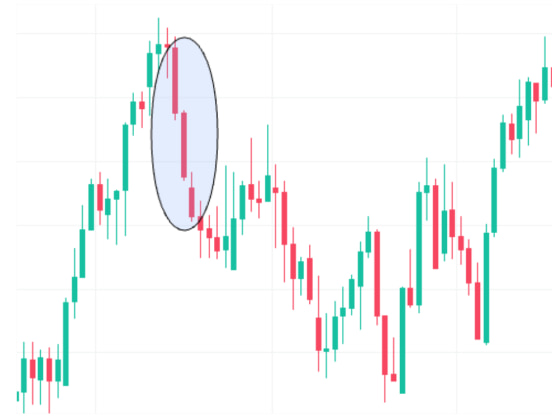
When an uptrend begins to lose strength and several bearish candlesticks form consecutively, it signals a shift in market sentiment toward selling pressure. This situation, known as the Three Black Crows pattern, reflects that buyers are no longer able to sustain support, while sellers have gained greater control over price movement.
The first candlestick often indicates hesitation, while the following two reinforce the message that market direction has changed. In some cases, the presence of confirming signals such as a Gravestone Doji candlestick can further validate the bearish sentiment and strengthen the likelihood of a trend reversal.
How to Trade the Three Black Crows Pattern in Forex
The Three Black Crows pattern becomes especially valuable in Forex trading when used in combination with tools such as support and resistance levels or technical indicators. As highlighted by sources like FXOpen, this pattern on its own is not sufficient. It should always be confirmed with additional analysis to minimize the risk of false signals.
How to Determine Entry and Exit Points When Trading the Three Black Crows Pattern
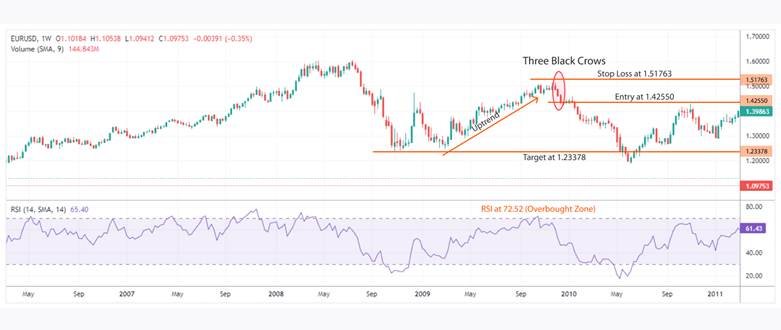
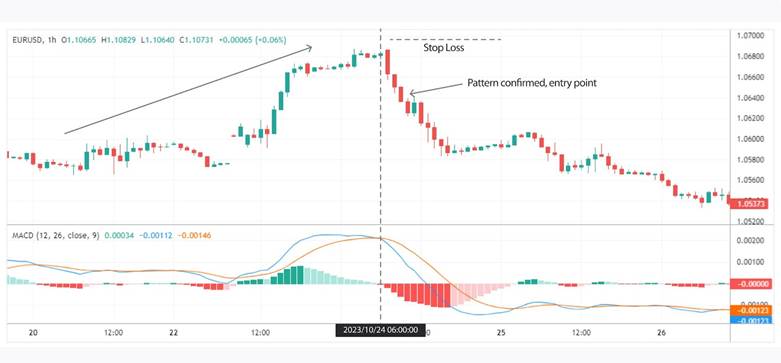
Traders typically enter a short position after the third candlestick closes, particularly if trading volume has increased or if a key support level has been broken at the same time. Exit targets can be set using Fibonacci retracement levels or upcoming support zones, allowing traders to manage potential profits more effectively.
How to Set Stop Loss When Trading the Three Black Crows Pattern
For proper risk management, it is advisable to place the stop loss above the high of the first candlestick or near the closest resistance level. This approach prevents short-term market fluctuations from triggering premature exits and ensures that capital management is handled with greater precision.
The Difference Between the Three Black Crows Pattern and the Evening Star Pattern
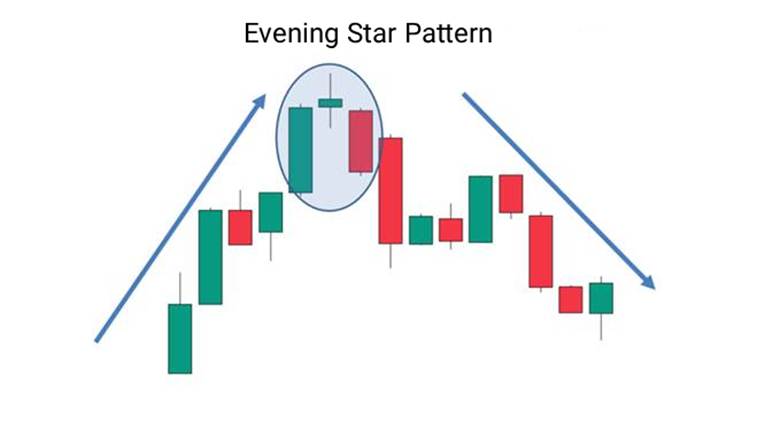
When three consecutive long bearish candlesticks appear on a chart, each closing lower than the previous one, it signals the formation of the Three Black Crows pattern. This structure reflects continuous selling pressure and a shift in market sentiment toward the downside. In contrast, the Evening Star pattern consists of one bullish candlestick, followed by a small-bodied candlestick, and then a bearish candlestick, often accompanied by a price gap.
The key difference lies in the structure. The Three Black Crows pattern forms without gaps and emphasizes the persistent strength of sellers, whereas the Evening Star pattern, with its combination of candlesticks and gaps, highlights the weakening of buyers and the potential beginning of a downtrend.
The Difference Between the Three Black Crows Pattern and the Bearish Engulfing Pattern
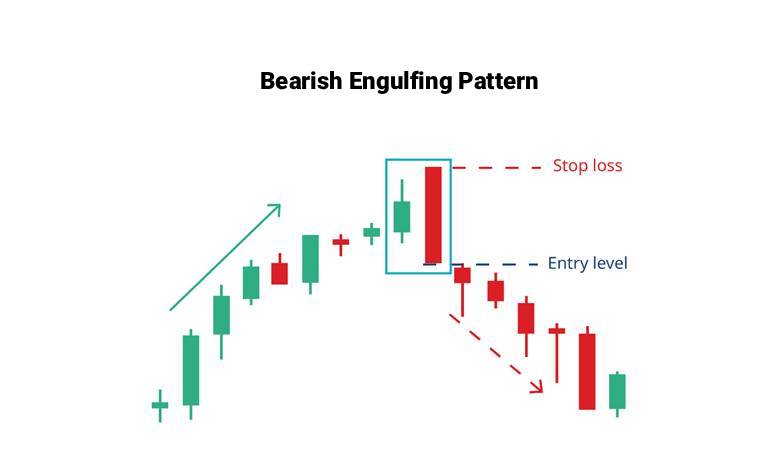
When three consecutive bearish candlesticks appear on the chart, each closing lower than the previous one, it signals that the market is losing its bullish momentum. This formation is known as the Three Black Crows pattern. In contrast, the Bearish Engulfing pattern is made up of only two candlesticks: a small bullish candle followed by a large bearish candle that completely engulfs it.
The main difference is that the Three Black Crows provides a more gradual and reliable signal of a bearish trend reversal, while the Bearish Engulfing pattern tends to appear more quickly and often reflects a sudden shift in market sentiment.
The Difference Between the Three Black Crows Pattern and the Three White Soldiers Pattern
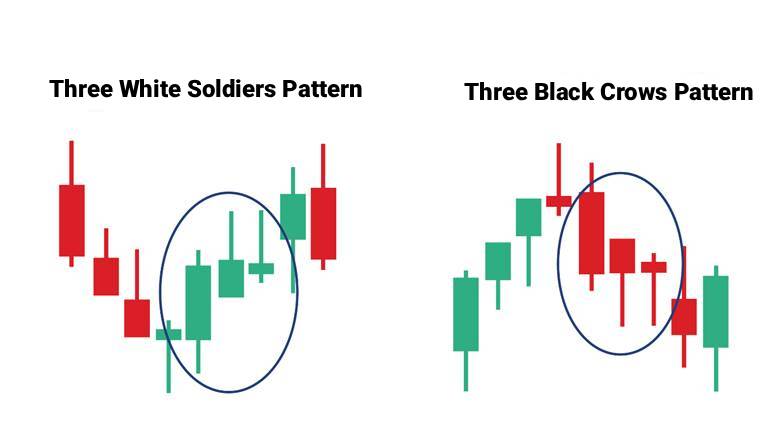
The Three White Soldiers pattern works in the opposite way to the Three Black Crows. In the Three White Soldiers pattern, three consecutive bullish candlesticks form after a downtrend, signaling a return of buying strength. In contrast, the Three Black Crows consists of three bearish candlesticks and indicates that sellers have taken control following an uptrend.
The main difference lies in the direction of the signal. The Three White Soldiers suggest the beginning of a new upward movement, while the Three Black Crows serve as a warning of increasing selling pressure. This contrast allows traders to apply each pattern differently depending on market conditions and trading strategies.
Combining the Three Black Crows Pattern with the RSI Indicator
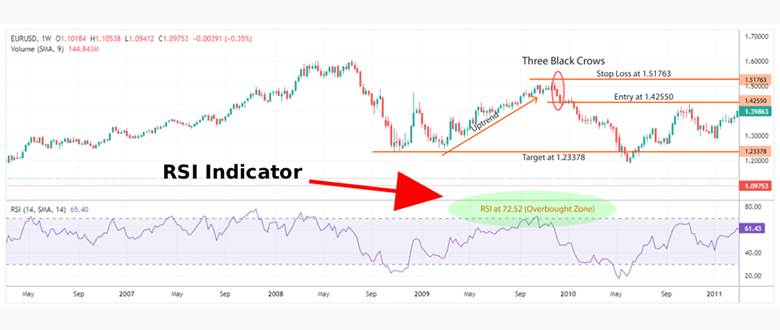
When the Relative Strength Index (RSI) moves above the 70 level, it indicates overbought conditions, which can add more credibility to a bearish reversal signal. If the Three Black Crows pattern appears under these circumstances, the bearish signal becomes much stronger because both the candlestick formation and the RSI confirm weakening buying pressure at the same time.
In some cases, a bearish divergence between price and RSI may also occur, further increasing the probability of a successful trade. This combination allows traders to enter short positions with greater confidence while reducing the risks associated with decision-making.
Combining the Three Black Crows Pattern with the MACD Indicator
When the Three Black Crows pattern suggests that a downtrend may be forming, waiting for a bearish crossover on the MACD can add more strength to the signal. This occurs when the MACD line crosses below the signal line or when the histogram shifts into negative territory, both of which increase the likelihood of a bearish trend beginning.
It is best to analyze this combination across multiple timeframes, such as daily or weekly charts, since shorter timeframes may produce misleading signals due to market noise.
Combining the Three Black Crows Pattern with Moving Averages
When price drops below a key moving average, such as the 50-day MA or the 200-day MA, and at the same time three consecutive bearish candlesticks appear, the bearish signal becomes more powerful. This combination suggests that sellers have gained stronger control over the market, increasing the likelihood of a continued downtrend.
In this setup, the Three Black Crows pattern serves as the primary signal, while the moving average acts as a confirmation tool. In some cases, signs of market indecision such as the appearance of a spinning top candlestick may also occur. When this happens alongside the pattern, it can serve as an even stronger warning of weakening buyer momentum.
Conclusion
A proper understanding of candlestick patterns in technical analysis is not just about recognizing their shapes but also about grasping the message behind each candle’s movement. The Three Black Crows pattern is a clear example of how a shift in trader sentiment can redirect the market. Using such signals wisely, together with patience, consistent practice, and sound risk management, will strengthen your analytical approach.
It is recommended to study this pattern under different market conditions and practice identifying it on a demo account to improve your skills. Now is the time to put your knowledge into practice and test it in real trading situations.